What We're Seeing in the Market
Westchester’s single-family home market turned in another solid quarter. There were 74 closed sales in the second quarter of 2026, matching the same quarter last year. The median sale price reached $1,762,000, up 2.1% year over year and 3.2% from the first quarter. Buyers also paid a median of $974 per square foot, 3.4% higher than a year ago.
At first glance, those numbers suggest another quarter of steady appreciation. But to us, the biggest story this quarter isn’t pricing, it’s how buyers are responding to individual homes.
Perhaps the strongest indication of today’s market is how quickly the right homes are still selling. Homes that were well prepared, marketed broadly, and priced correctly found buyers in a median of just 18 to 20 days. Only three of the 74 sales, about 4%, needed to be withdrawn and relisted before finding a buyer, a significant improvement from nearly 18% last quarter.
At the same time, homes currently on the market tell a different story. The typical active listing has now been available for more than a month, almost twice as long as the homes that successfully sold this quarter. That gap reflects a market where buyers are becoming increasingly selective. They’re still willing to pay strong prices, but they’re taking more time to evaluate their options and rewarding homes that present the best value from day one.
The pricing data reinforces that conclusion. The median home that sold this quarter measured 1,806 square feet, about 4% smaller than in the first quarter. Smaller homes naturally command a higher price per square foot, so part of the increase reflects the mix of homes that sold rather than a sharp jump in values. Looking at the year-over-year numbers provides a clearer picture: Westchester continues to experience steady, measured appreciation rather than rapid price acceleration.
If there’s one takeaway from this quarter, it’s this: Westchester remains a healthy and resilient market, but success depends more than ever on preparation, pricing, and presentation. Homes that hit the market ready to impress continue to sell quickly, while those that miss the mark are taking longer to find the right buyer.
| Metric | Current | YoY Δ | QoQ Δ | Q2 2025 (2025-04-01 – 2025-06-30) | Q1 2026 (2026-01-01 – 2026-03-31) |
|---|---|---|---|---|---|
| Sales Count | 74 | 0.0% | 76.2% | 74 | 42 |
| Median Price | $1,762,000 | 2.1% | 3.2% | $1,726,500 | $1,707,500 |
| Median PPSF | $974 | 3.4% | 6.4% | $942 | $915 |
| Median Sqft | 1,806 | 5.1% | 4.1% | 1,904 | 1,884 |
| Median DOM | 18.5d | 42.3% | 2.6% | 13d | 19d |
Westchester Neighborhood Breakdown
North Kentwood
North Kentwood remains the top tier of Westchester's higher end neighborhoods. While the median sale price was lower than last quarter and a year ago, the change was driven largely by the mix of homes that sold rather than a decline in demand.
Sixteen homes sold at a median price of $2,137,500, down 11.3% from a year ago and 12.2% from the first quarter. At the same time, buyers paid a median of $1,052 per square foot, the highest in Westchester and well above the area's 2025 median of $974 per square foot. Sales ranged from $1,418,880 on Chase Avenue to $4,050,000 on El Manor Avenue, with five homes closing above $3.1 million.
Homes that were publicly marketed went under contract in a median of 20 days. Three additional sales on El Manor Avenue, Ogelsby Avenue, and Agnew Avenue sold off market and are not included in that figure, a reminder that some of North Kentwood's most desirable homes still trade privately.
The takeaway is simple: demand for North Kentwood remains strong, and the lower median price this quarter reflects the homes that sold more than the market itself.
Closed Sales (16)


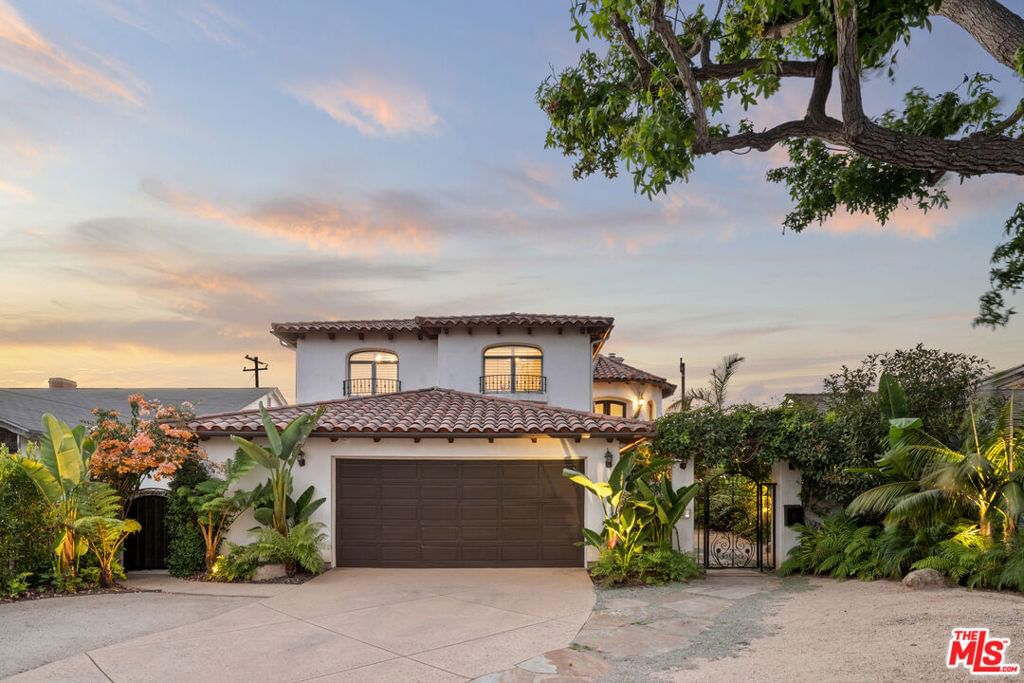
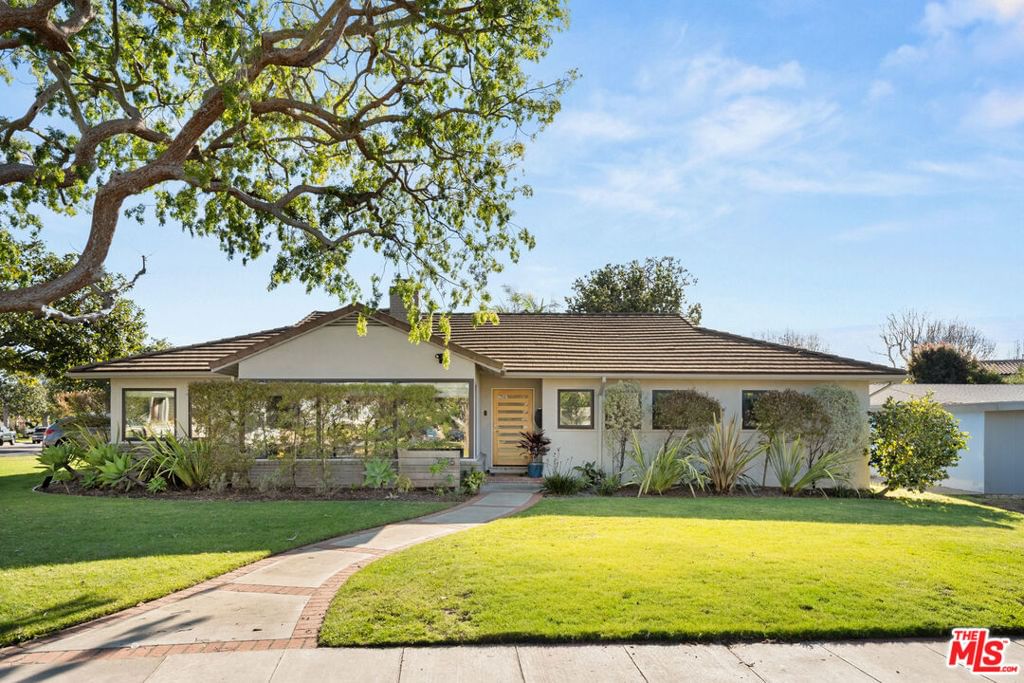
South Kentwood, Loyola Village & West Westchester
South Kentwood, Loyola Village, and West Westchester were the busiest part of the market this quarter, accounting for 25 of Westchester's 74 single-family home sales. With a wide range of home styles and price points, this area continues to provide one of the clearest snapshots of the overall Westchester market.
The median sale price reached $1,805,000, up 4.6% from a year ago and nearly identical to the area's 2025 median of $1,797,500. While the median was lower than the first quarter, that difference was largely driven by the mix of homes that sold. The luxury market remained active as well, with four homes closing above $3.35 million, led by 8363 Stewart Avenue at $3,750,000.
Homes that were publicly marketed went under contract in a median of just 18 days. Four additional sales on Chase Avenue, Dunfield Avenue, and two on McConnell Avenue sold off market and are not reflected in that figure.
The takeaway is consistency. Demand remains healthy across all price points, and well-priced homes continue to attract buyers quickly.
Closed Sales (25)


Westport Heights & West Westchester - South
Westport Heights and West Westchester South had the strongest quarter of any Westchester neighborhood. The median sale price reached $1,754,500, up 9.7% from a year ago and 16.6% from the first quarter, while the median price per square foot climbed to $974, second only to North Kentwood. Unlike the overall market, where changes in the mix of homes sold influenced pricing, this area saw gains in both median price and price per square foot, a sign of broad-based demand.
The area's 18 sales ranged from $1,225,000 to $2,550,000, led by top sales on Truxton and Vicksburg. Homes that were publicly marketed went under contract in a median of just 19 days. One sale on 74th Street closed off market, and one of the quarter's three relisted homes, 7272 W. 90th Street, ultimately sold for $1,770,000 after a successful repricing.
The takeaway is clear: Westport Heights and West Westchester South continue to be among the strongest-performing neighborhoods in Westchester, with healthy buyer demand and steady appreciation across the market.
Closed Sales (18)


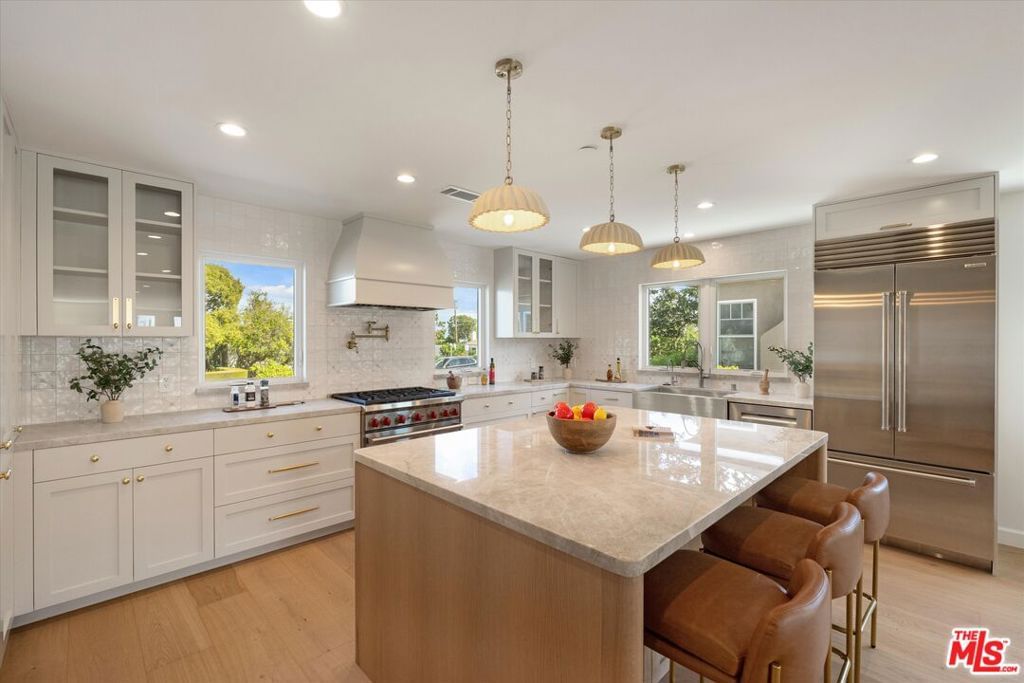


Osage, Emerson Manor, Nielsen & Westchester Triangle
The Osage, Emerson Manor, Nielsen, and Westchester Triangle area continues to offer the most affordable entry point into Westchester's single-family home market. Fifteen homes sold at a median price of $1,285,000, virtually unchanged from both last quarter and a year ago, making this the most stable neighborhood in the report.
Sales ranged from $865,000 on Thornburn Street to $1,961,000 on Winsford Avenue. That top sale achieved $1,102 per square foot, well above the area's median of $848 per square foot, demonstrating the premium buyers are willing to pay for a fully updated home.
Homes that were publicly marketed went under contract in a median of 18 days, matching the pace of Westchester's higher-priced neighborhoods. This was also the only area with no off-market sales and no relists, as every home sold through the public market on its first listing.
The takeaway is simple: this neighborhood continues to offer outstanding value, giving buyers a more attainable path into Westchester without sacrificing demand or market stability.
Closed Sales (15)

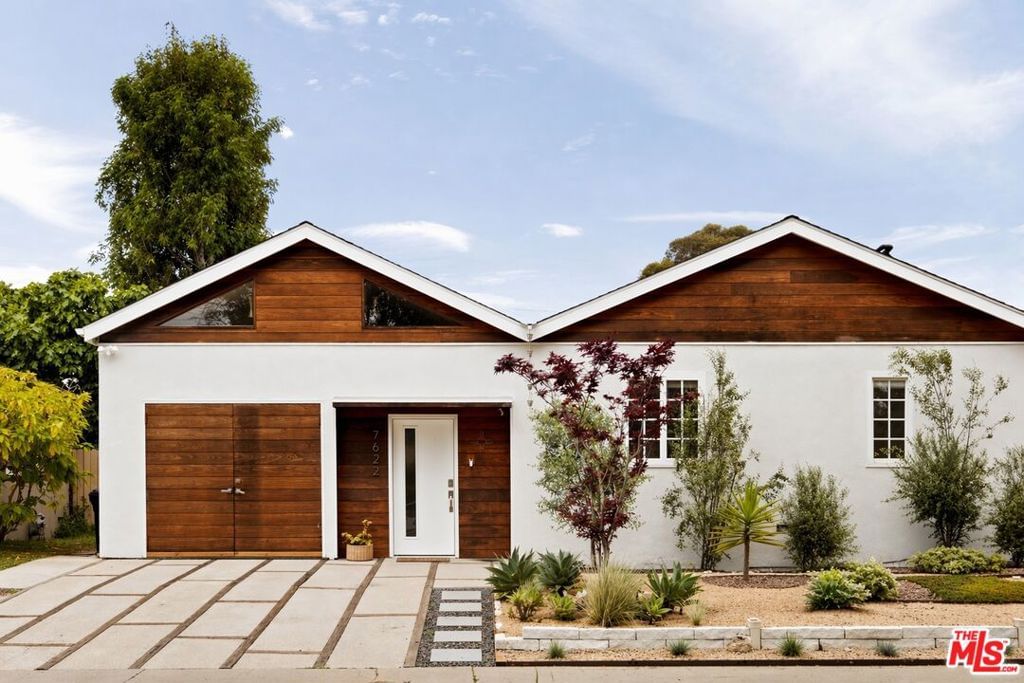


One Westbluff
No closed sales this quarter
One Westbluff had no closed sales this quarter. That's not unusual for this exclusive bluff-top enclave, where few homes exist and owners rarely sell. A quiet quarter here is less a sign of weak demand than a reflection of extremely limited inventory. One Westbluff remains Westchester's premier luxury neighborhood, with a 2025 median sale price of $3,366,500.
Buyers interested in One Westbluff should expect limited opportunities and be ready when a home does come to market. In fact, activity has already picked up in the early weeks of the third quarter. Two homes went into escrow in the first half of July, and our team just closed an off-market sale at $3.5 million. Demand here hasn't gone quiet.
Attached Homes
Condos, townhomes, and attached properties across Westchester.
Attached (Condos & Townhomes)
Westchester's condos and townhomes are reported as one market since there are too few quarterly sales to break them down by neighborhood. Five attached homes sold this quarter at a median price of $700,000, above the 2025 full-year median of $640,000, though the small number of sales can cause the median to fluctuate from quarter to quarter.
Sales ranged from approximately $500,000 for smaller condominiums to just over $1 million for a four-bedroom condo, illustrating the wide variety of housing options available within Westchester. Homes that were publicly marketed went under contract in a median of 20 days, although one Belford Avenue condominium took considerably longer to sell, highlighting how condition, pricing, and location can still influence buyer demand.
At a median of $572 per square foot, attached homes remain the most affordable path into Westchester homeownership. Whether you're a first-time buyer, downsizing, or looking for a lower-maintenance lifestyle, the condo and townhome market continues to offer solid value across a broad range of price points.
Closed Sales (5)


Current Market Snapshot (as of July 20, 2026)
As of July 20, 2026, Westchester had 65 homes for sale, including 52 single-family homes and 13 attached homes, with another 24 properties in escrow. Homes currently on the market have been listed a median of 37.5 days, including 34 days for single-family homes and 49.5 days for attached homes.
This is the first quarter we're tracking active days on market, so there isn't a historical trend yet. Even so, the comparison to recent sales is telling. Homes that sold this quarter found a buyer in a median of about 18 days, while the typical home still on the market has been listed for more than five weeks. Some of that difference is expected since the fastest-selling homes leave the market first, but it also shows that buyers continue to reward homes that are priced and presented well.
Mortgage rates remain an important part of the equation. According to Freddie Mac, the average 30-year fixed mortgage was 6.55% in mid-July, down slightly from 6.75% a year ago, and has remained relatively stable in the mid-6% range throughout the summer.
| Sub-Area | Active SFR | Active Attached | UC SFR | UC Attached |
|---|---|---|---|---|
| North Kentwood | 13 | 0 | 7 | 0 |
| Westport Heights | 14 | 0 | 3 | 0 |
| Westchester Triangle | 1 | 11 | 0 | 1 |
| South Kentwood | 10 | 0 | 3 | 0 |
| Osage | 5 | 0 | 4 | 0 |
| Loyola Village | 2 | 0 | 4 | 0 |
| Nielsen | 2 | 2 | 0 | 0 |
| West Westchester - South | 3 | 0 | 0 | 0 |
| Emerson Manor | 2 | 0 | 0 | 0 |
| One Westbluff | 0 | 0 | 2 | 0 |
Seller Strategy
This quarter reinforced a simple lesson: the market rewards accurate pricing. Just 4% of sales required a relist before finding a buyer, a significant improvement from nearly 18% last quarter. Across Westchester, homes that were priced well and marketed effectively typically went under contract in just 18 to 20 days.
The flip side is just as important. The median active single-family listing has now been on the market for 34 days. While every home is different, properties that remain available beyond the first few weeks are often receiving valuable feedback from buyers, and that feedback frequently points to pricing.
For sellers, preparation and pricing matter more than ever. Buyers are still active, but they're also well informed. The homes that generate the strongest interest are those that enter the market in excellent condition, are priced competitively, and receive broad exposure from day one.
Buyer Strategy
Westchester remains a competitive market, but buyers have more opportunities today than they did a few years ago. Prices continue to rise at a measured pace, mortgage rates have remained relatively stable, and with 65 homes currently on the market, buyers have real choices.
One of the best opportunities may be homes that have been on the market for several weeks. While many properties continue to sell quickly, listings that have lingered often provide buyers with greater room to negotiate on price or terms.
Data Source: CRMLS and CLAW via Repliers MLS API. All sales classified by official Team Tami sub-neighborhood boundaries.
Methodology: v1.1. Median values used throughout. Days on market calculated as list-to-pending; off-market sales (0 DOM) excluded from DOM calculations. Relist detection uses cancel/terminate/expire/withdraw chain logic.
Report by: Tami Humphrey, Team Tami Real Estate
Generated: July 20, 2026
