Deciphering Current Movements and Anticipating What Lies Ahead
Let’s delve deep into the intricacies of the Westchester property market, highlighting its current momentum, potential trajectories, and the intricate balance of supply versus demand.
Zooming In: Westchester’s Market Pulse
Whether you’re a longstanding homeowner in Westchester or someone eyeing prospective properties, staying informed about market shifts is essential. But distinguishing short-term fluctuations from enduring changes can be challenging. Here, we spotlight the Trailing Twelve Months (TTM) metric as a key indicator.
Understanding the Trailing Twelve Months (TTM) Metric
Regarded as a cornerstone in market analysis, the TTM metric evaluates recent sales records by amassing sufficient data to outline prevalent market patterns. Through this measure, one can gain a clearer view of market behavior and anticipate its potential direction.
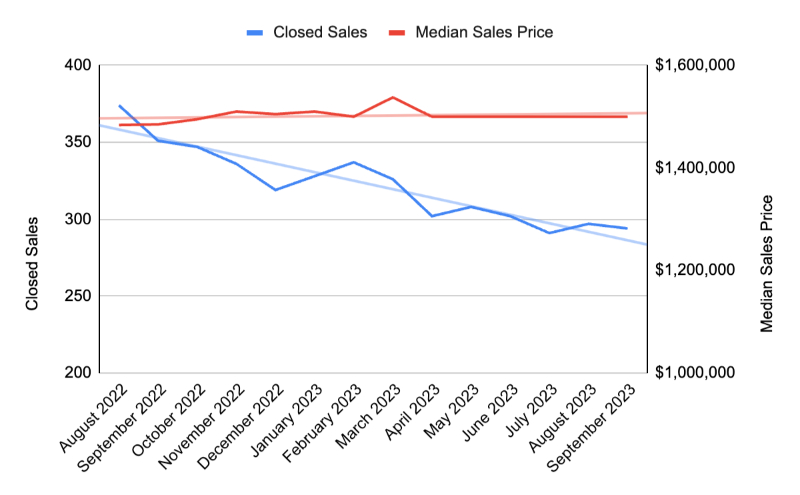
Westchester, CA Closed Sales and Median Sales Prices
Trailing 12 Months (TTM)
A Dip in Completed Transactions
Recent data points to a consistent drop in the number of real estate transactions. Comparing the TTM for September 2023, which recorded 351 sales, to that of September 2022 with 294 sales, we observe a 16.24% decrease in closed transactions.
Historically, in Westchester, data from before the pandemic suggests an average of about 354 property sales annually between 2014 and 2019. This figure serves as a benchmark to evaluate the post-pandemic property landscape. Sales in Westchester have seen a drop of nearly 17% compared to this average, with heightened interest rates being the primary culprit.
Nonetheless, when compared to other nearby markets, Westchester’s property listings and transactions have proven to be steadier than those in Playa Del Rey and Playa Vista. The number of closed sales are down 33% in Playa Del Rey and 48% in Playa Vista comparing Sept 2022 to Sept 2023 TTM. The values in these markets have behaved similarly to Westchester with level median sales prices.
As we move into the typically slower fall/winter real estate season, combined with sustained high interest rates, we may continue to witness much lower than normal inventory levels and consequently, a drop in the number of properties trading hands.
Value Fortitude: Maintaining Median Sale Price Levels
With a decline in the number of closed sales, the median sales price has held its ground. One of the key reasons is homeowners’ hesitance to part with their properties due to favorable mortgages. At the same time, elevated interest rates have somewhat stymied potential buyers. That said, the steady nature of the median sales price suggests a harmonious equilibrium between demand and supply.
In Westchester, the pinnacle for the median sales price was reached in March, registering at $1,537,500. By September, there was a slight recalibration to $1,500,000, translating to a 2.4% decrease from the March figure. However, when we look at the year-over-year statistics for September 22 to September 23 TTM, there’s a modest increase of 1%.
Understanding ‘Days on the Market’ Trends
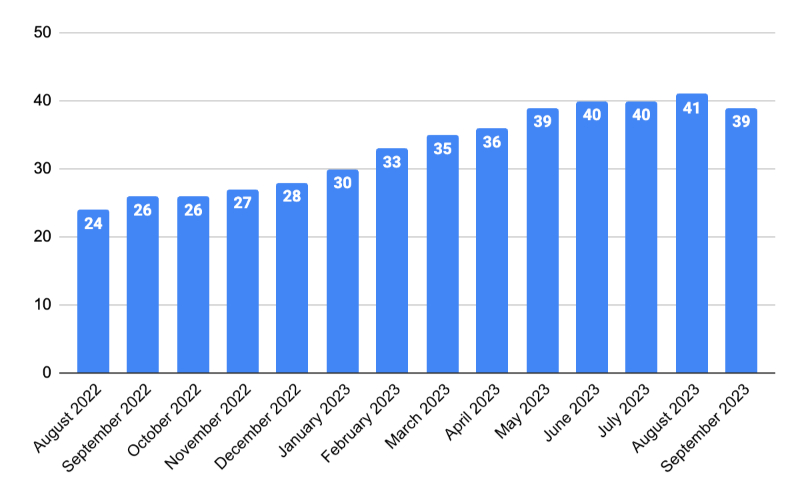
In the height of the pandemic, when interest rates were at their lowest and demand sky high, properties in Westchester were snatched up in an impressive average of just 26 days. This swift pace has since slowed down. By September 2023, properties lingered on the market for an average of 39 days, a shift largely attributed to the surge in interest rates the year before. However, not all is bleak: there’s an encouraging trend emerging where the slow steady increase in days on market has leveled off. With July recording 40 days and August noting 41 days as the average time on the market, there’s been a modest reduction recently to the 39 days on market for Sept 2023 TTM.
Westchester, CA Average Days on Market
Trailing 12 Months (TTM)
Navigating Inventory Trends in the Wake of Climbing Interest Rates
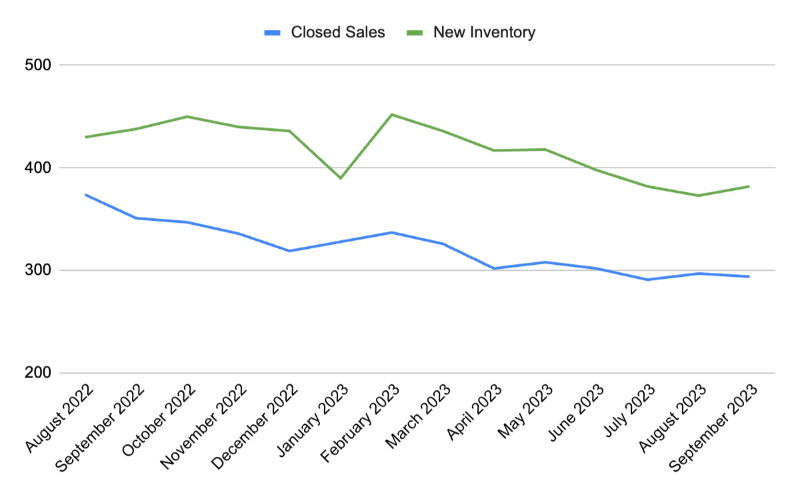
A significant factor shaping the Westchester property market is the evident rise in interest rates locking in homeowners. The idea of homeowners exchanging their current favorable rates for those exceeding 7% has deterred many from listing their properties. This dynamic has constricted the pool of properties up for grabs. This is the main reason for the lack of supply in the market and also for the resilient prices in the face of the highest interest rates we’ve seen in two decades. The relationship between supply and demand is always at the core of market prices.
Westchester, CA New Inventory and Closed Sales Comparison
Trailing 12 Months (TTM)
What’s Next for Interest Rates? Anticipations for 2024 and Onward
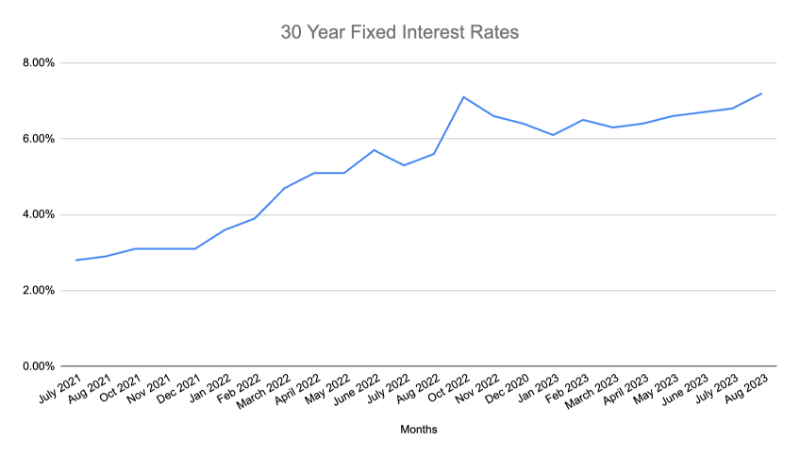
The path of interest rates remains at the forefront for both prospective buyers and investors. Recent data from Freddie Mac indicates that the average rate for a 30-year mortgage soared to 7.31% during the week of September 28, marking its highest point since December 15, 2000.
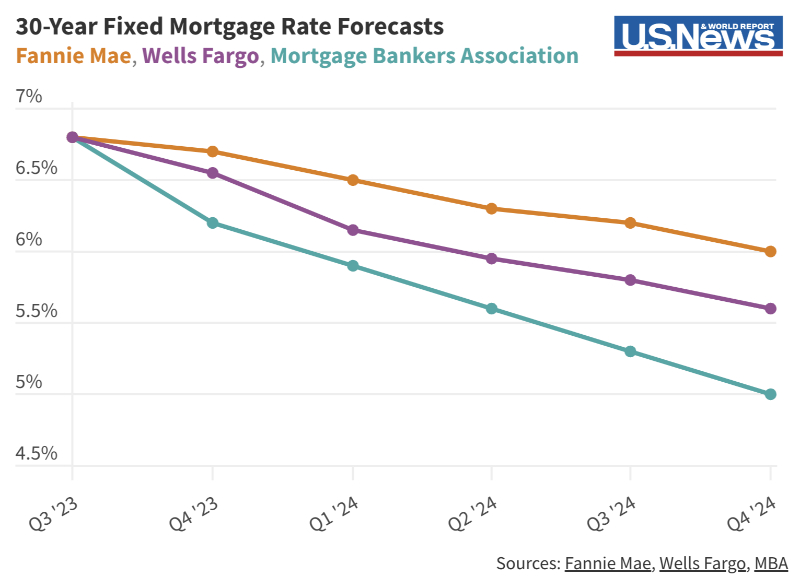
However, leading financial institutions—including the likes of Wells Fargo, Fannie Mae, and the Mortgage Bankers Association—are forecasting that rates will either hold steady or possibly taper off in 2024. Morning Star is notably optimistic, predicting a drop to around 4.5% by 2025. How might these projections shape the property landscape? Could we see an influx of available homes, heightened buyer interest, or even rising property values?
30 Year Fixed Mortgage Rates
July 2021 – September 2023
Mortgage Rate Forecasts
Wells Fargo, Fannie Mae, Mortgage Bankers Association
Wrapping Up
The Westchester property market stands out for its resilience, continuously drawing attention and activity. With the ever-changing landscape of mortgage rates and the delicate balance between demand and supply, it’s imperative for potential homeowners and investors alike to remain updated. A deep understanding of this market’s nuances will pave the way for more informed decisions moving forward.
